

Recently PowerBI had its birthday and I put a tweet out there on twitter asking what type of dashboard people would like to see in celebration. Well the results came in pretty quick and it was almost a tie between OSD and an update to my existing SoftwareUpdates PowerBI dashboard.
As a result I decided to do a new dashboard for PowerBI and OSD and to later on update the Software Updates dashboard inline with some of the new features that have come out for PowerBI since the last update.
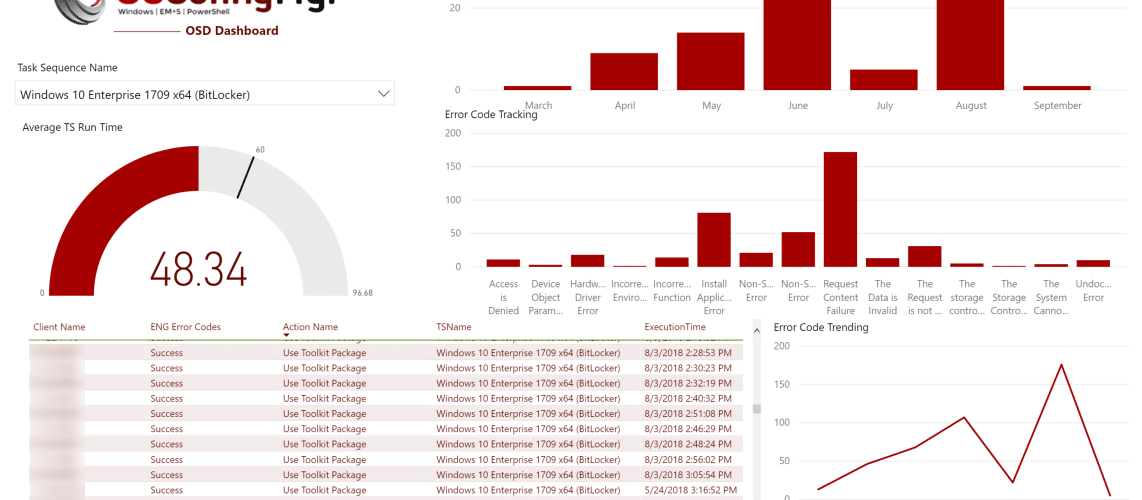
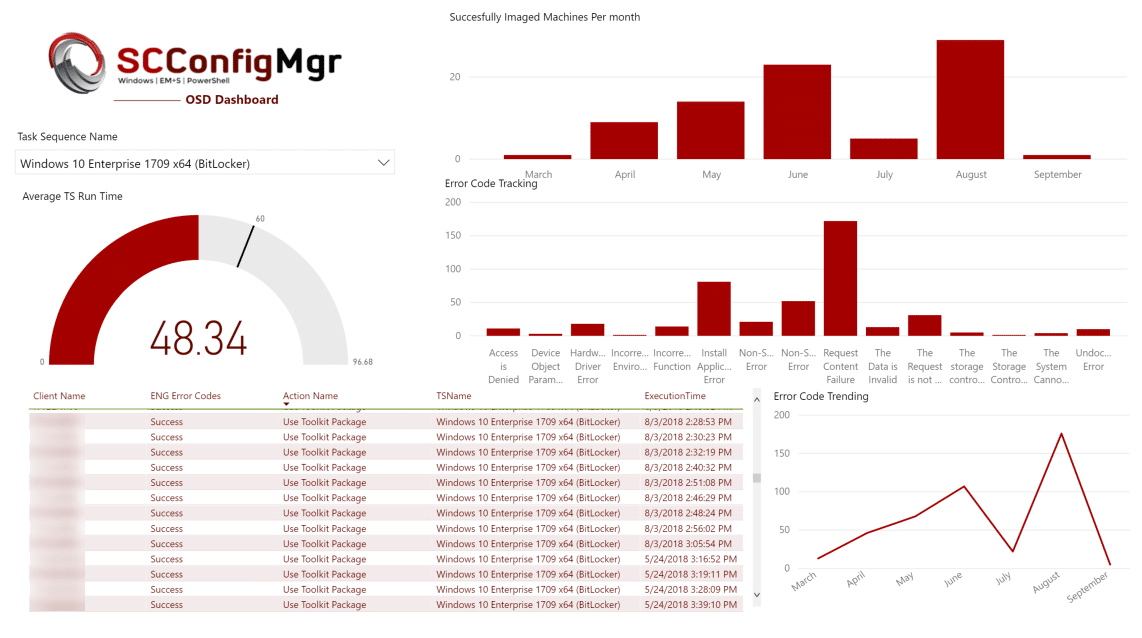
So without further adue, I would like to introduce everyone to version 1.0 of the SCConfigMgr OSD Dashboard.
This dashboard is available for download from TechNet and all incremental/WIP updates will be stored in the SCConfigMgr GitHub Repository.
This template is a little different than templates I’ve released in the past because of some of the new features that have been released with the new PowerBI. Instead of updating the data source settings they are now handled as parameters within the report. When you first open the template it will prompt you to provide it with a ServerName and the Database Name using the FQDN.
Once you hit load, depending on settings and permissions you may be prompted for credentials or warned regarding encrypted connections getting past these is relatively simple and has been covered in my other PowerBI reports.
Now lets get into what exactly the report is doing the first big query you’ll encounter is the gather every step executed and its exit code/time component. this is done for a couple of reasons first to establish the number of times a specific error code on a specific step occurs and to allow you to organize the steps in a particular order. At a later date I intend to do some DAX work that will show the duration of time spent on each OSD step I also convert error codes to known error codes here rather than doing a bunch of handling in the PowerBI template with hundreds of applied steps to navigate. This data is stored in the ‘TaskExecutionData’ table in PowerBI and you can review the SQL used to gather this information below.
--Gather every step executed and its exit code/time--
Select Distinct v_R_System.Name0
    , max(v_TaskExecutionStatus.Step) as 'Step'
    , v_TaskExecutionStatus.ActionName
    , v_TaskExecutionStatus.ExitCode
    , CASE v_TaskExecutionStatus.ExitCode
    WHEN 0 THEN 'Success'
    WHEN 128 THEN 'Non-Standard Error'
    WHEN -2147467259 THEN 'Install Application Error'
    WHEN 41 THEN 'Hardware Driver Error'
    WHEN 16389 THEN 'Request Content Failure'
    WHEN -1073741819 THEN 'Access is Denied'
    WHEN -2016409851 THEN 'Redundant Write'
    WHEN -2016410032 THEN 'Device Object Parameter Not Valid'
    WHEN -2145123271 THEN 'Non-Standard Error'
    WHEN 1 THEN 'Incorrect Function'
    WHEN 10 THEN 'Incorrect Environment'
    WHEN 115 THEN 'Non-Standard Error'
    WHEN 13 THEN 'The Data is Invalid'
    WHEN 14 THEN 'Not Enough Memory'
    WHEN 191 THEN 'Non-Standad Error'
    WHEN 2 THEN 'The System Cannot Find the File Specified'
    WHEN 50 THEN 'The Request is not Supported'
    WHEN 7 THEN 'The Storage Control Blocks Were Destroyed'
    WHEN 9 THEN 'The storage control block address is invalid'
    Else 'Undocumented Error'
    End AS 'ENG Error Codes'
    , v_TaskSequencePackage.Name
    , V_TaskExecutionStatus.ExecutionTime
from v_TaskExecutionStatus
left outer join v_Advertisement on v_TaskExecutionStatus.AdvertisementID = v_Advertisement.AdvertisementID
Left outer Join v_R_System on v_TaskExecutionStatus.ResourceID = v_R_System.ResourceID
left outer join v_TaskSequencePackage on v_Advertisement.PackageID = v_TaskSequencePackage.PackageID
where v_TaskSequencePackage.BootImageID is not NULL and v_TaskExecutionStatus.ActionName != ''
Group By v_TaskExecutionStatus.ActionName,v_R_System.Name0,v_TaskSequencePackage.Name,v_TaskExecutionStatus.ExecutionTime,v_TaskExecutionStatus.ExitCode
Order By Name0,ExecutionTime
The second important query which depending on the size of your environment may take some time to run again – I did some of the math work in SQL – assuming that your SQL server can handle the math better than some desktops can this can be changed by leveraging DAX expressions if so desired. This query attempts to get a machines name and the start/end time for the device. I may later change this to ResourceID depending on feedback to help minimalize the possibility of generating ‘bad math’ where a machine with the same name stacks its time by being re-imaged. However in my testing so far this hasn’t seemed to be a large issue. This Query simply gets the max and minimum start time for the TS for the machine and calculates the difference.
Select Distinct
    v_R_System.Name0 ,
    MAX(v_TaskExecutionStatus.ExecutionTime) as 'END TIME',
  MIN(V_TaskExecutionStatus.ExecutionTime) as 'Start Time',
  DATEDIFF(MINUTE, MIN(V_TaskExecutionSTatus.ExecutionTime) , MAX(V_TaskExecutionSTatus.ExecutionTime)) as 'The Difference',
  V_Package.Name
from v_TaskExecutionStatus
left outer join v_R_System on v_TaskExecutionStatus.ResourceID = v_R_System.ResourceID
left Join v_AdvertisementInfo on v_AdvertisementInfo.AdvertisementID = v_TaskExecutionStatus.AdvertisementID
Left join v_Package on v_Package.PackageID = v_AdvertisementInfo.PackageID
left outer join v_Advertisement on v_TaskExecutionStatus.AdvertisementID = v_Advertisement.AdvertisementID
left outer join v_TaskSequencePackage on v_Advertisement.PackageID = v_TaskSequencePackage.PackageID
where v_TaskSequencePackage.BootImageID is not NULL
Group By v_R_System.Name0,v_Package.Name
order by V_r_system.Name0
The last important table that in the ‘PowerBI’ template you might want to look at is the ‘GoalCriteria’ table. This is a manually built table where I arbitrarily chose 60 minutes as being the goal for image duration. This can be changed by selecting edit queries, select the table, click the gear to the right of ‘source’ for the table edit the value and select OK.


[…] There are various ways you can achieve the end results. You can query directly against the Configuration Manager database, and there are several Power BI dashboards available to do just that. For example, Jordan Benzing has a real nice OSD dashboard that does exactly that here. […]
What parameter should be used if my SQL Server is a standalone server. For instance my Site server is called appp01 and the sql server is called SQLP01.
I would love to use this dashboard!
Thanks in advanced!
Roger
This report only needs to be connected to the SQL server.
If your SQL instance is separate you would use the FQDN of the actual server the sql server the database lives on say ‘Example01.Exampledomain.com’ – and then the database on that server. No need to use the SCCM server fqdn then.
Thanks for the prompt reply!! I did that and I am now getting an error (which I cannot copy from the window) so here is the jist of the message: An error happened while reading data from the provider: ‘Could not load file or assembly ‘system.enterpriseservices, version=4.0.0, culture=neutral, publickeytoken=astringofdata’ or one of its dependancies. either a required impersonation level was not provided, or the provided one is invalid (Exception from HRESULT: 0x80070542)’ any thoughts would be helpful. I know the user account that I am using has read rights as I can log on to the CM Console with it and see data.
I’m getting that the pbit file is corrupt or an invalid report file when trying to open?
Interesting I don’t get that but I’ve seen something that ‘looks’ like that usually when you are running and older version of PowerBI than what the report was authored in. I would start with checking your PBI version.
Thanks – could be the version, I’m running the October 17 version at the moment with a local PowerBI server.
That is quite possible. I think you can install both the R version (specifically frozen to the server version) and desktop current month at the same time.
I had to change the End Time to be “Show items when the value: is in this, year”. Doing that shows the correct “Succesfully Imaged Machines per Month” for the current year.
That’s an ‘OKish’ short term fix but I’ve got to address the back end query still to prevent it from choosing the really wrong date and making it look like OSD takes literally years to complete.
Second question.. It appears that “Success” is being reported as an error as well.
Shouldn’t be… send me a screen shot 🙂
Disregard.. I saw “Success” listed in the “ENG Error Codes” column and had assumed.
Yep there is a PowerBI filter that prevents those from being added to the counts but they are still IN the data techncially.
Hello! This is amazing! The only question I have is that the Average TS Run Time is showing as 18.00K (yes that is a K) for me.
I’ve heard that a couple of times from people usually that means you have a TS somewhere that ran over and over and over and crushed the numbers in your environment OR the numbers got doubel because of re-using the time.
I saw one customer where because of the duration of runs of Bitlocker over and over taking a ridiculous amount of time it got strange.
Take a look at what it returns for the ‘run time’ in the table and see what those numbers look like per machine.
you can also e-mail me a screen shot to take a look at.
I had the same issue too.
A quick resolution for me was to filter the Min and Max times to less than 12 hours. Adding this having statement to the bottom of the TSRunTimeTotals query seems to address the issue for me.
Having DATEDIFF(HOUR, MIN(V_TaskExecutionSTatus.ExecutionTime) , MAX(V_TaskExecutionSTatus.ExecutionTime)) < 12
That’s one way to do it is editing the SQL the other way is in the report page itself set a PowerBI visual filter on the report/page level to only show things from the current year. I perfer that option as that doesn’t ‘hide’ data back in the database.
I’ve got the same issue, with 3.51K showing. What data do you need to see?
Fantastic report, Jordan! Very useful during Windows 10 migrations.
I’m seeing the issue you mention pertaining to the second major query where devices which are rebuilt multiple times give a skewed average time.
Is it safe to remove the execution status data associated to that machine from the TaskExecutionStatus table to clean this up? Alternatively how you would handle this scenario?
Glad you liked it!
I’ll be working on getting an update out around the dashboard later this week that fixes the issue with the time stamping I know how to fix it just haven’t had time to test and update it yet.
Regarding removing data, there isn’t a great way to remove that data other than just letting configmgr do its maintenance work. If you are talking about removing the database information no it is very very very not supported to do that. You could clean that information up in PowerBI once its been returned and I’ll look at how that can be better filtered.
cheers,
-J