
Microsoft Intune has for a good time now included built-in logs for activity in your Intune environment. Up until now there has not been any native support for getting a aggregated view of these logs. I have earlier written about how we could do that with Azure Automation and Runbooks to extract that data here: Export Microsoft Intune Audit Data
Recently Microsoft has released native support for Intune Diagnostics enabling us to export data to Log Analytics with a few simple clicks. That also means native support for sending the same data to an Azure Event Hub or storing logs in a storage account if you have the need to hold logs for a longer period than 30 days. In Intune we can now setup diagnostics for both Audit logs and Operational Logs (preview). The Audit logs shows details on each events or tasks in our Intune Enviroment. The Operational Logs shows details around enrolment of users or devices.
In this post I will explain how to setup the integration, it I quite simple, and also how you can build your own queries and create graphic views for your dashboard. I will also mention the how you can integrate this with a 3rd Party Security information and event management (SIEM) system like for instance SPLUNK. Lets get started with the easy parts.
Prerequisites:
To get started we need the following:
- Azure Subscription (and a user with rights to deploy resources)
- Intune Enviroment
- Global Admin rights (or Intune Service Administrator)
Enable Diagnostics
The first thing we need to do is to create a Log Analytics Workspace. I have already written about that in step 3 in the previous blogpost about Intune Audit Data, So I will not spend time on writing that one more time. So the next we now need to do is to go into Intune and turn on diagnostics. Go to Microsoft Intune in your Azure Portal and under Monitoring you will find Diagnostic Settings:
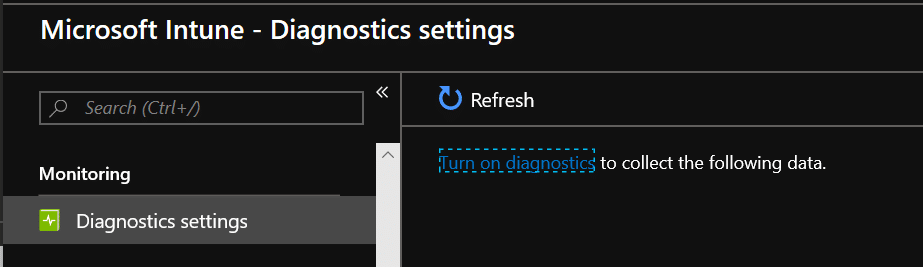
Click on Turn on diagnostics
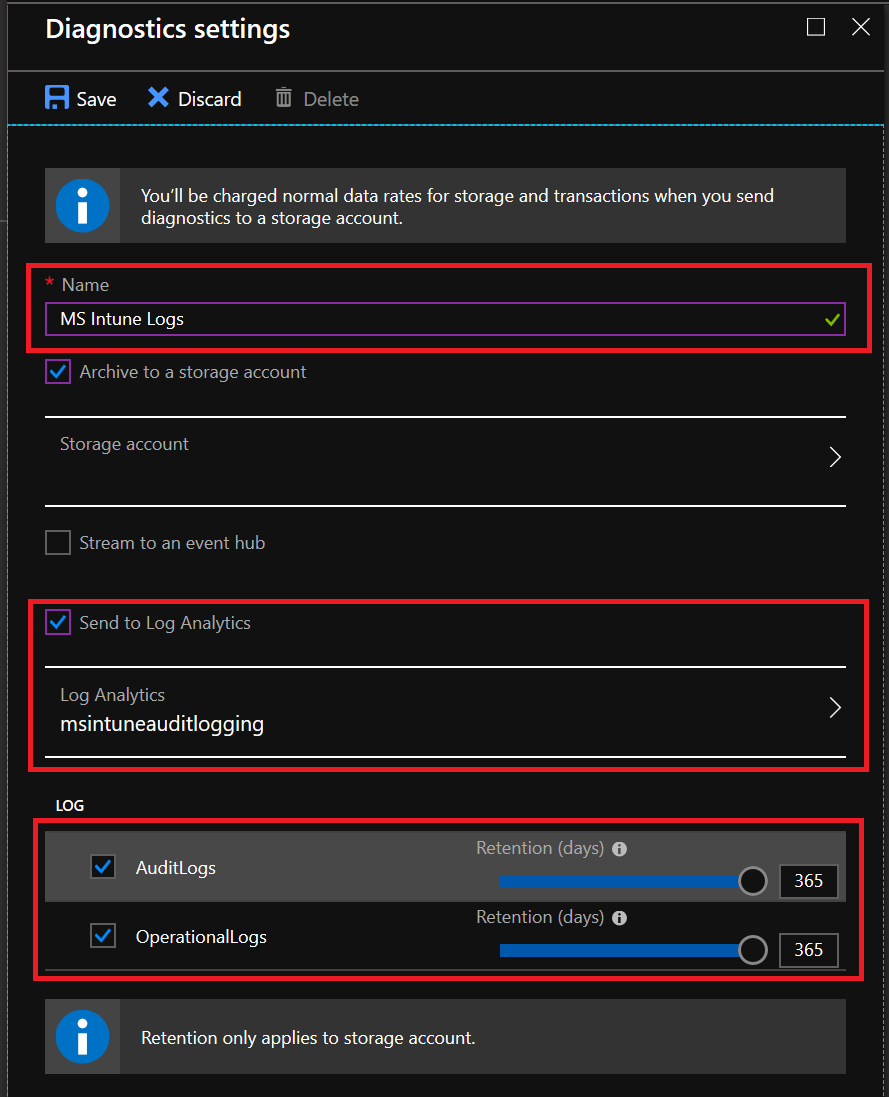
On the configuration side we have several options. I have configured this with both a Storage account with a 365 Days Retention on logs in addition to sending the logs to log analytics.
Do a few admin actions inside your tenant (refresh policies, make a demo policy, update defender signatures or something) and wait a few minutes before you go ahead on trying to find logs.
Log Analytics Workspace
In the log analytics workspace we can now find our logs.
The Log Workspace will only have data from the time you enabled log forwarding, it will not contain any data from before that.
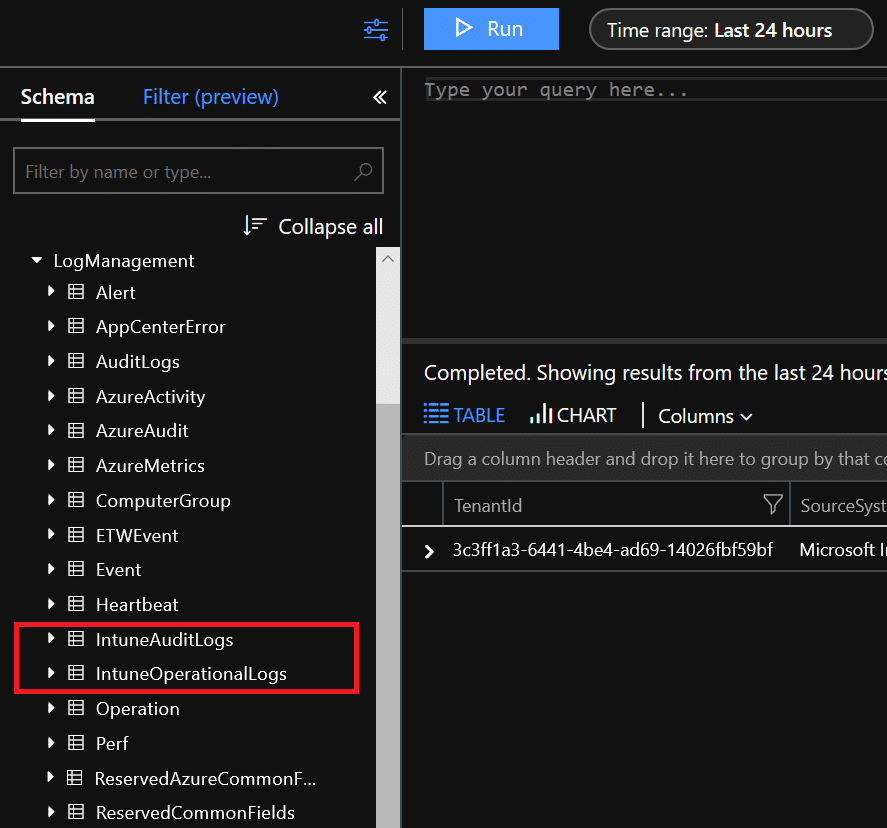
Go into your log workspace and choose Logs
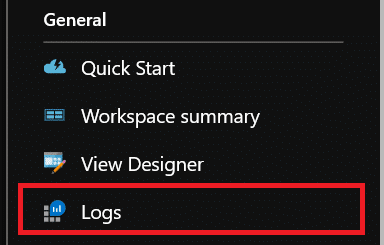
The logs we are looking for are IntuneAuditLogs and IntuneOperationalLogs which both can be found under LogManagment
So lets start with a very simple querie. In the query field, type the following:
IntuneAuditLogs
| limit 50
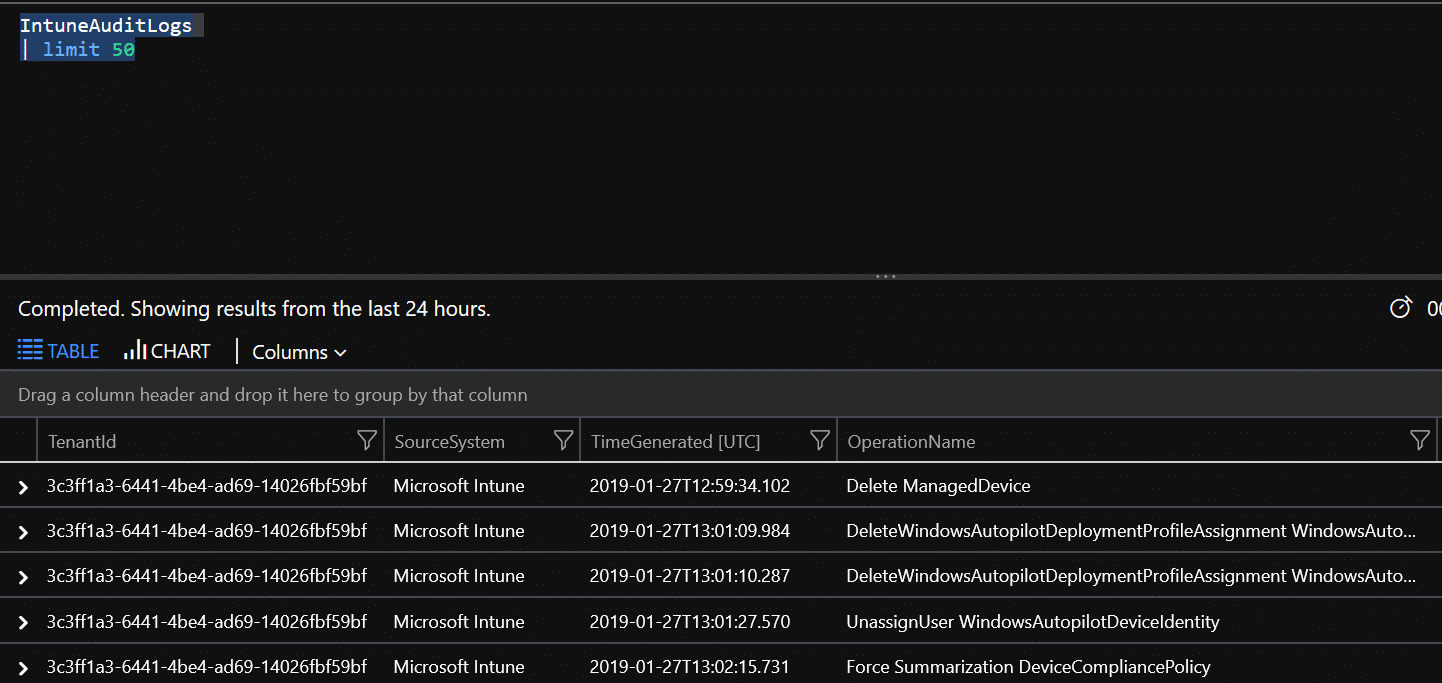
As you can see, the admin actions from the last 24 hours are visible. I don’t really like this view that well, but we have all the data here and can use queries to give us the view we want. Or we can export the data to CSV or PowerBI(M Query) if we want to work with the data in another way, create a report or what we like. Lets us try another easy query:
IntuneAuditLogs
| top 10 by TimeGenerated
| project Identity, OperationName , SourceSystem
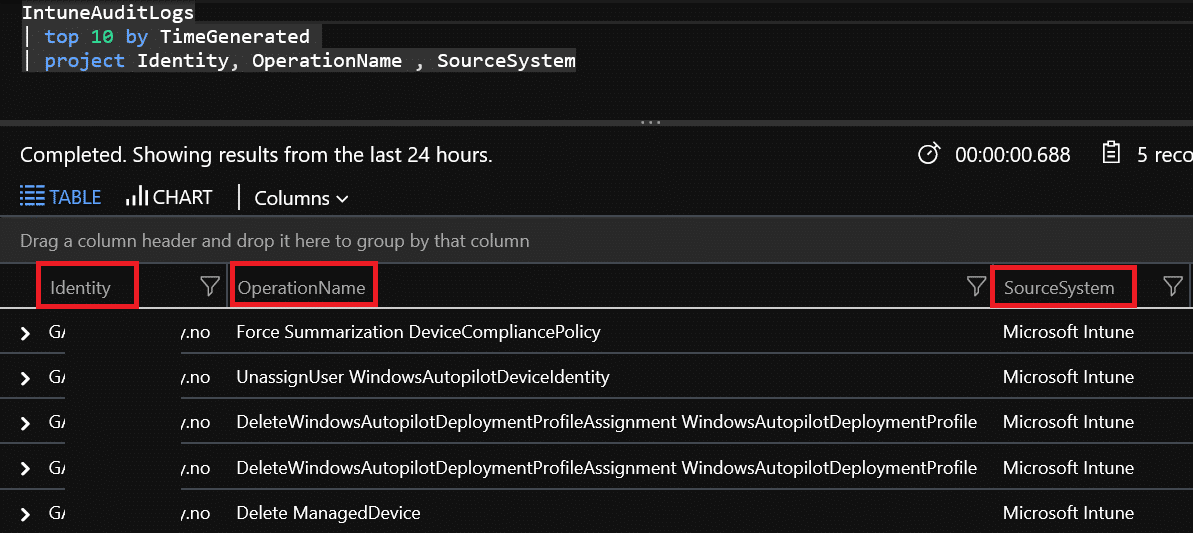
This query gives us the last 10 entries while projection only what we are looking for, who did what change.
Create dashboard items
Overview Tile
To be able to create a nice dashboard view, we need to create a query that summarize what we are looking for. The first one I have created is for a simple donut like in my preview post:
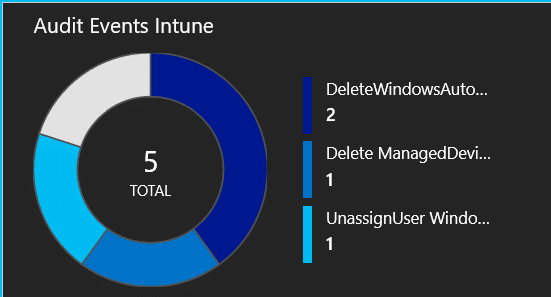
To create this view I use the following query:
IntuneAuditLogs |summarize Auditevents = count() by OperationName | sort by Auditevents
In the log analytics workspace click on View Designer. It is probably pretty empty. So start by pulling in the donut:
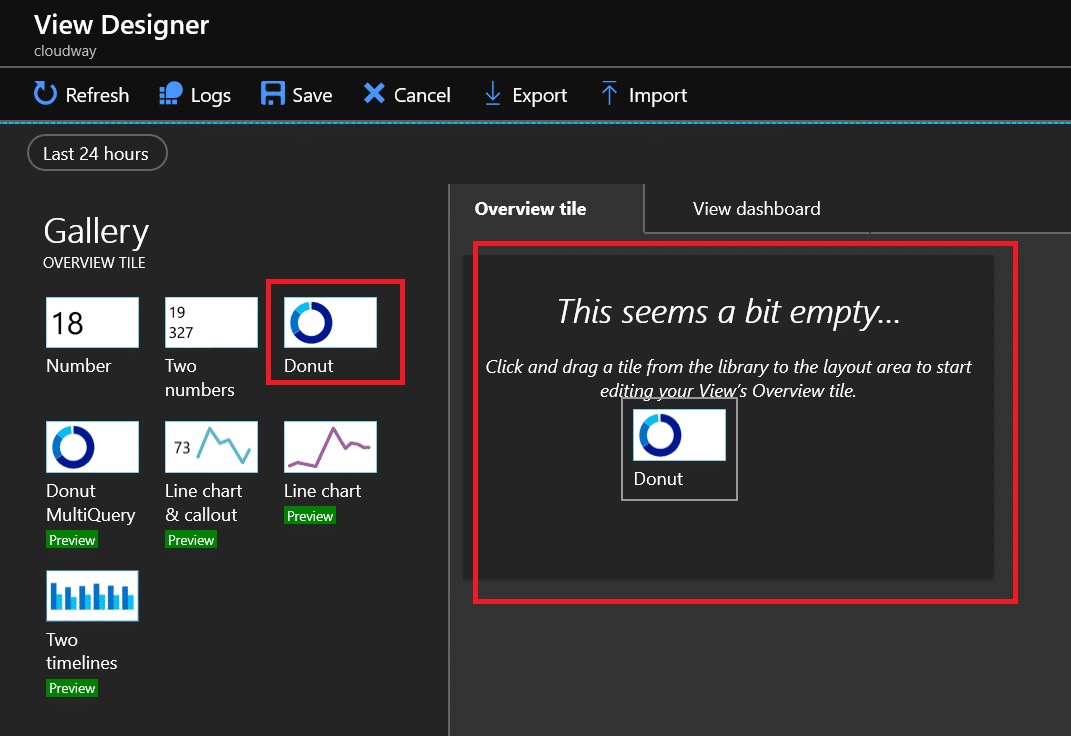
When it arrives it picks up some data, that we are not interrested in so we need to change this to use our query instead. Give your view a name and input the Query under Donut->Query
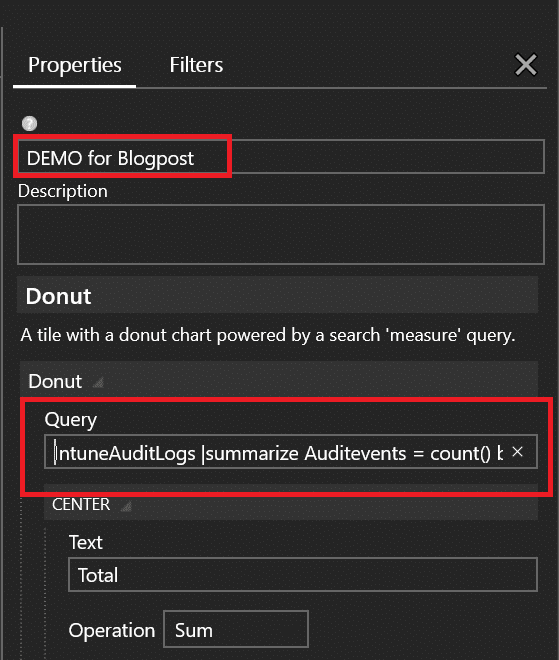
Click Apply on the bottom and you will see the result on the overview tile. Now Click Save on the top line.
Dashboard Items
Now that we have our overview tile you probably realize that when you click on it you come to an empty page. That is because we have not yet created our dashboard. So click on edit and go to the dashboard section:
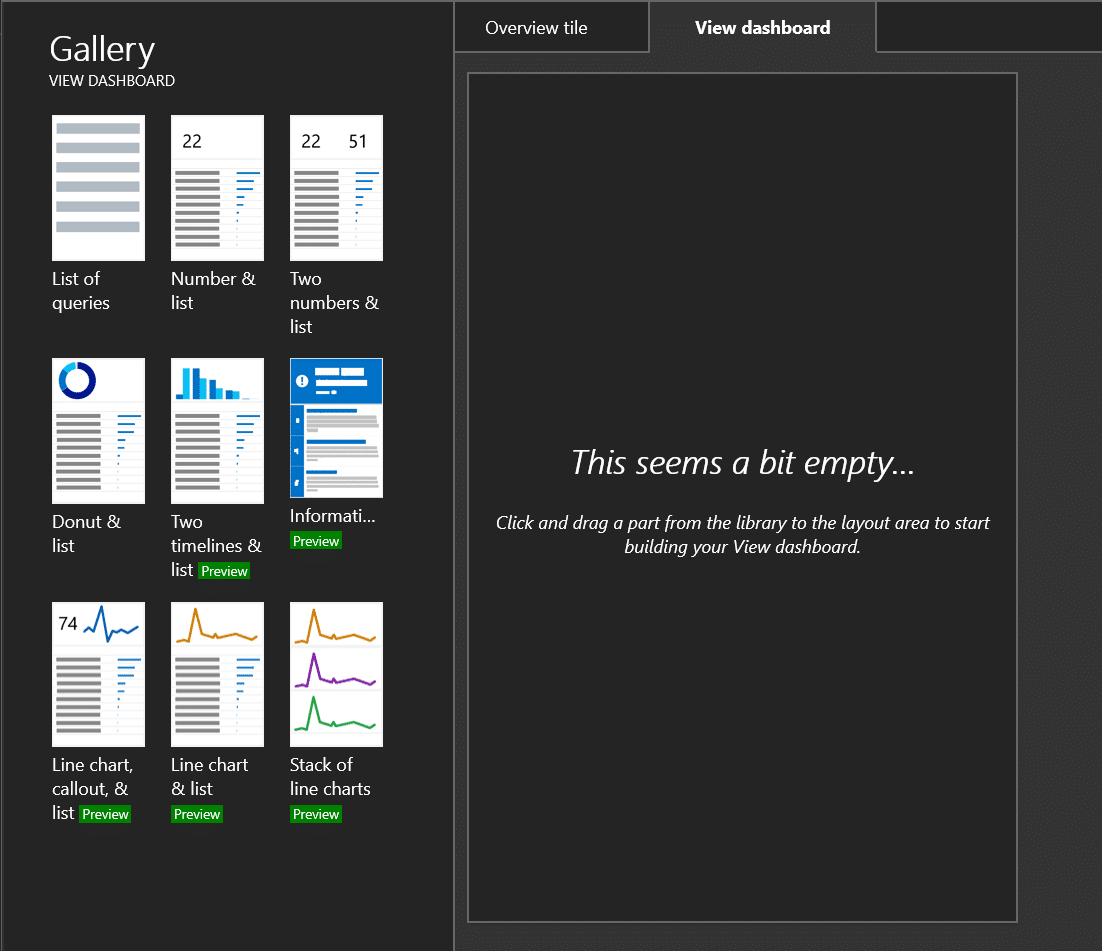
I wanted to see a view with distribution on activity type and activities sorted by who performed the action itself. So what I want to see is this:
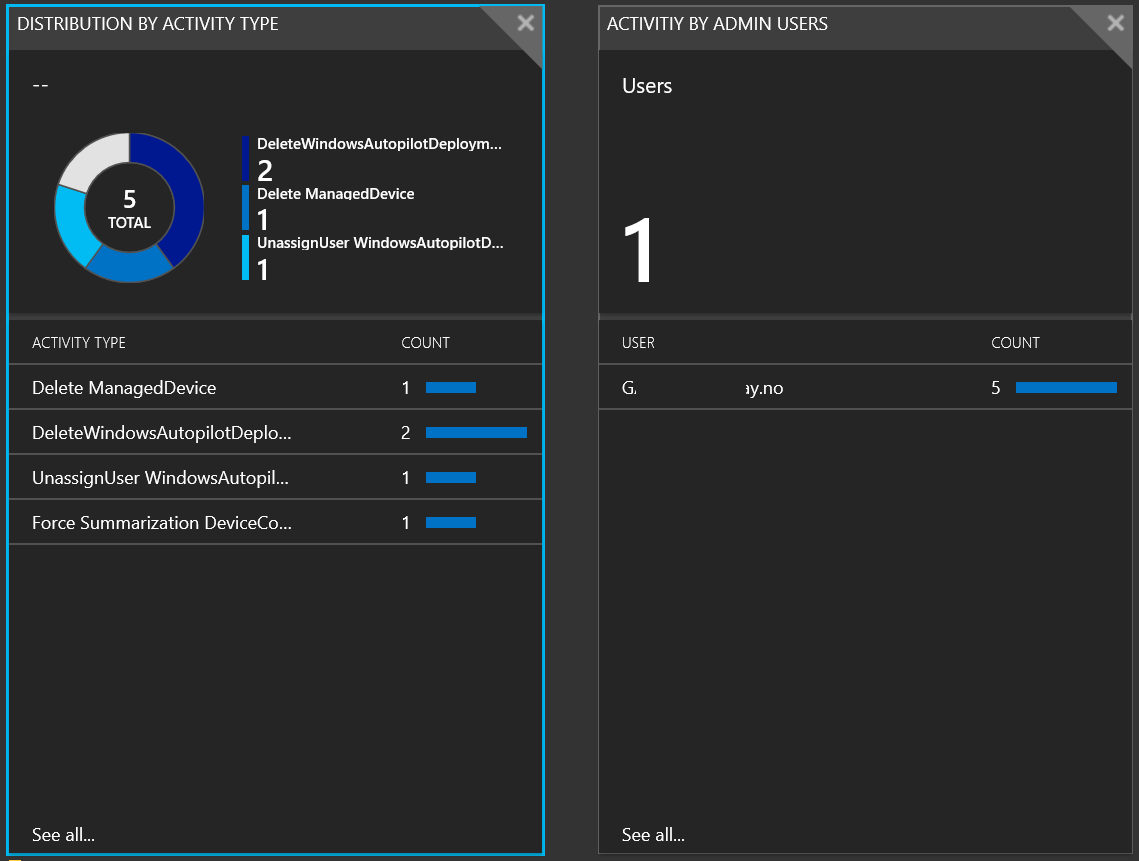
So for this I am adding the “Donut & List” + “Number & List” to my dashboard from the Gallery.
For the first one, the donut query is the same as the previous donut. This second query for the list is as follows:
IntuneAuditLogs | summarize AuditEvents = count() by OperationName
For the second one I am adding 2 queries. First one is for the total numbers of admins doing actions. The second one for the numbers of actions per admin.
IntuneAuditLogs | summarize AdminUsers = count() by Identity | count
IntuneAuditLogs | summarize AdminActions = count() by Identity | sort by Identity
It is actually quite easy to make the first level of insight based on these simple one-liners I have used here. Do you have any queries that can give more insight here? I would love some good suggestions here.
SIEM Integration
I am by no means an expert in any SIEM tool, but for larger organizations I have been working with lately this has been a huge ask. The whole idea with a SIEM solution is to collect data from as many relevant sources as possible into one system and then have intelligence on top of that to enable security operators to react on incidents in their environment. To enable that kind of integration we would use a Azure Event Hub, stream all logs into this event hub and from there push the data forward to the SIEM solution.
If you are interested in learing more about what this is and how to do this, I recommend that you take a look at this article from docs.microsoft.com : Stream Azure monitoring data to an event hub for consumption by an external tool


Great article, this is useful! Also good that you mentioned SIEM. This is a huge oppurtunity for great monitoring regarding Intune-monitored devices.
When I run the Query
IntuneAuditLogs
| top 10 by TimeGenerated
| project Identity, OperationName , SourceSystem
I do not get any log information, is there something I could be doing incorrectly?
The query is correct. I tested on my own setup. You have probably realized by now, logs are not in real time, and there might be delays.
In IntuneOperationalLogs, there is a properties column, that contains many values, is it possible to split/extract parts of this value for example, the IntuneUserID, so one can make some charts from this?
Yes, you can use parse for that. Properties is a string that you can parse out.
More information can be found here: https://docs.microsoft.com/en-us/azure/azure-monitor/log-query/parse-text