
Recently at Microsoft Ignite I attended a session with David Falkus (BRK3026) where he showed some of the possibilites of leveraging Microsoft Graph to report on key data from Intune and transfer audit events to Azure Log analytics I deciced I had to try to get this working for my self. The whole idea behind this is to more easily get an insight into what is happening in your enviroment and potentially get this data to external sources like for instance SPLUNK (SIEM). I started with looking at what my friends have done before me regarding Azure Automation and MS Graph autentication and I got what I needed from my fellow bloggers Nickolaj and Oliver. Will refer to the corresponding blogs in the bottom of this post.
This post will describe in details what you need to do to get it all up and running in your own environment.
I went through 6 different steps setting this up the way I wanted:
- Create a Native Application in Azure AD for connecting to Graph
- Create a Azure Automation Account for running the task on a schedule
- Create a and configure OMS Workspace enabled for diagnostics to consume the audit data
- Create the Runbook script
- Define my Log analytics Query
- Add and pin the Cool Donut on my dashboard
1. Create the native application in Azure AD
Let us start with creating the Azure AD Native app we need. How to do this has already been documented a while ago by Nickolaj, so you can find the details on the steps needed in here: Create an Azure AD App…
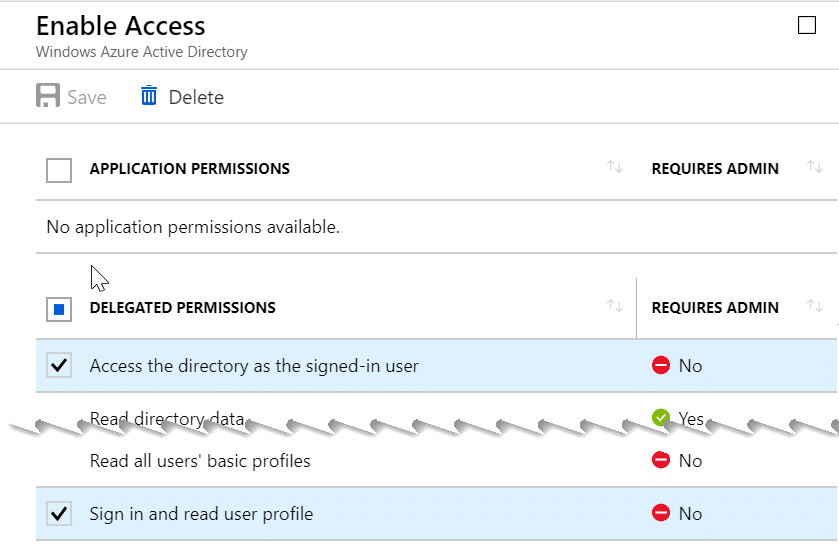
So when you have done what is described in that post, we can take a look at what permissions I have used on my app. I am going to use this app for more than just audit reporting so I am going to give it a bit more rights to be ready for future automation tasks I want to build. To change the permissions for the app you go back into Azure AD, App Registration and click on your app:
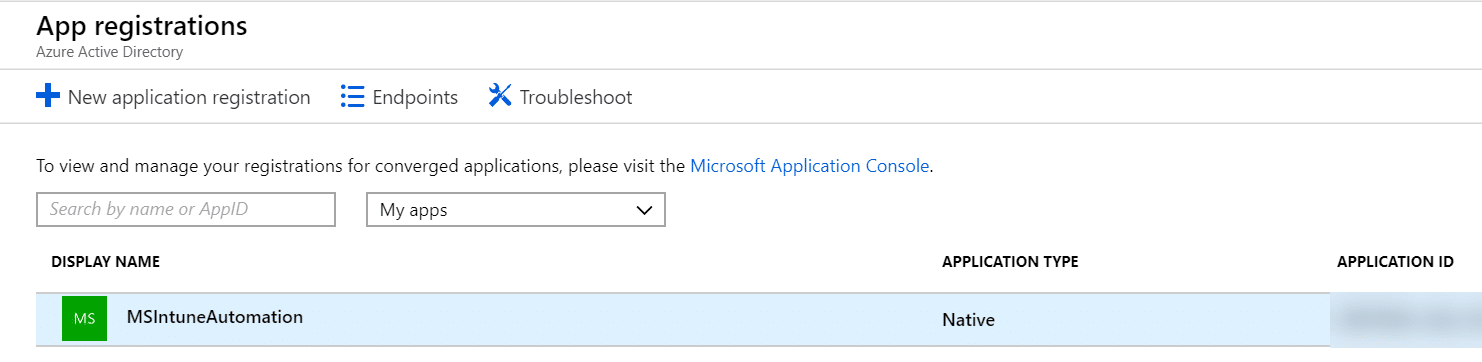
Then you will get into this blade. Please take a note of the Application ID (we need it later) and click on settings:

In the next blade that shows up we go into “Required Permissions” and verify that we have the following rights in Windows Azure Directory API and Microsoft Graph API:
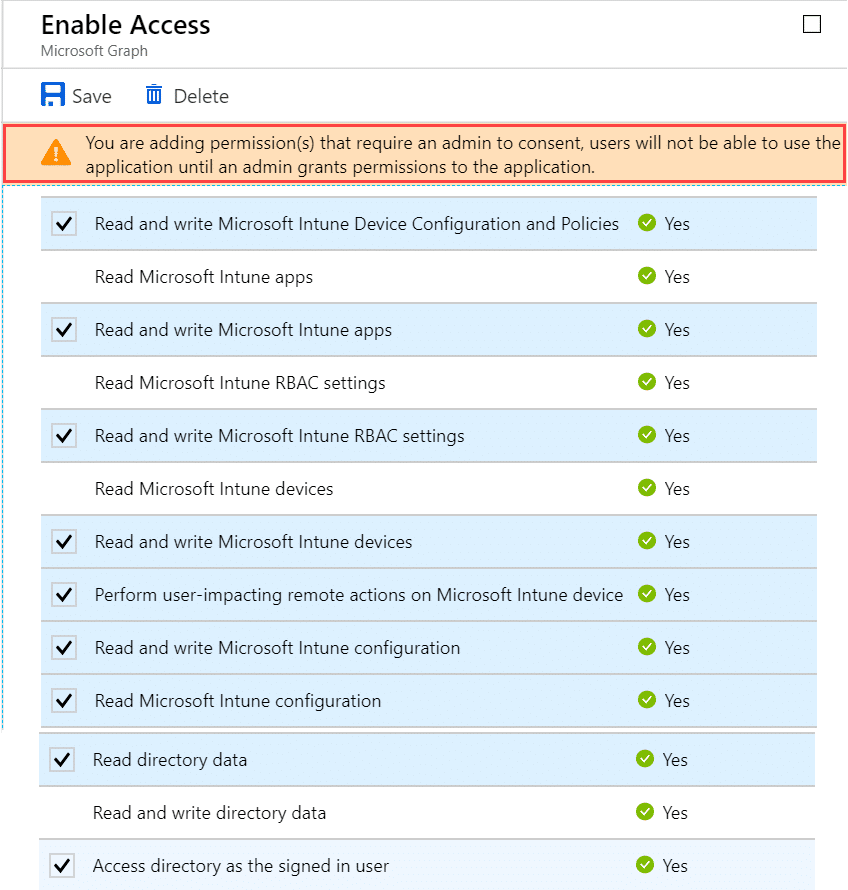
MS Graph API – Note the Warning about admin consent.
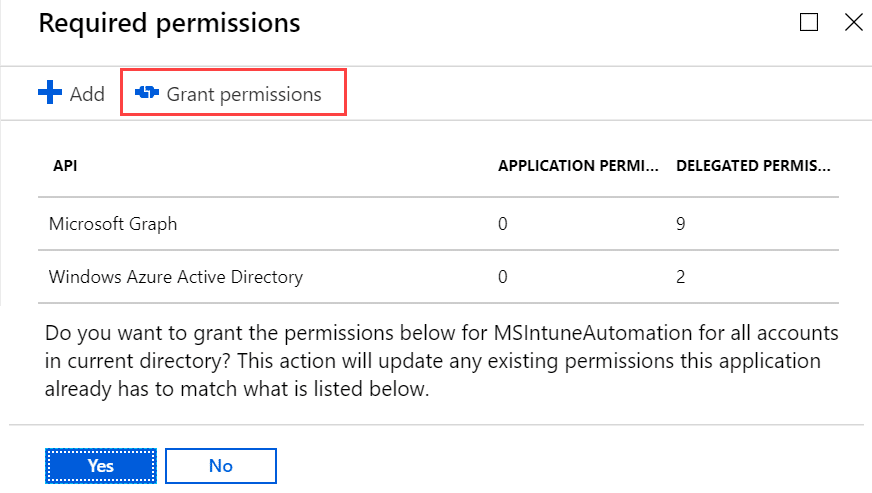
When we have given the correct permission is is important to also Grant Permissions (Admin Consent) so that the app are allowed to do administrative tasks. Click on Grant Permissions and answer yes to grant it:
2. Create a Azure Automation Account for running the task on a schedule
Also here we have something useful to start with already written by Nickolaj, Getting started with Microsoft Intune and Azure Automation, in this post he explains the whole process of setting up the Automation Account. He also moves into how to configure the Runbook. As my scenario is not the same here I am going to explain in next steps how I configured my runbook. You also need to add a user with administrative rights under Credentials and I am using the PSIntune Auth module made by Nickolaj as well to do authentication so make sure you follow the steps on how to do those steps from his blogpost. There are also some other steps we need to make here to allow for the output stream of the job to be written to Azure Log Analytics.
3. Create a OMS Workspace enabled for log analytics to consume the audit data
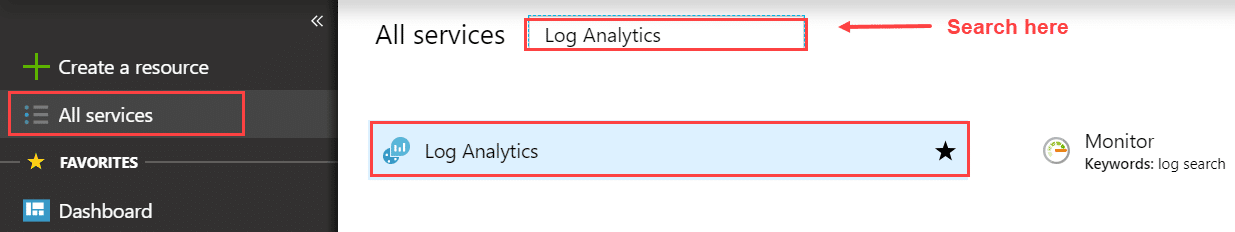
To enable log analytics we need to set up a OMS Workspace to send data to, and then make sure output from our runbook is written to log analytics. I am going to assume that you don’t have a OMS Workspace to use or that you are creating a new one for this specific scenario. Let us start by going into https://portal.azure.com and find Log Analytics and add it you our menu.
Now you can you into Log Analytics and click on +Add on the top menu and then configure your workspace as needed.
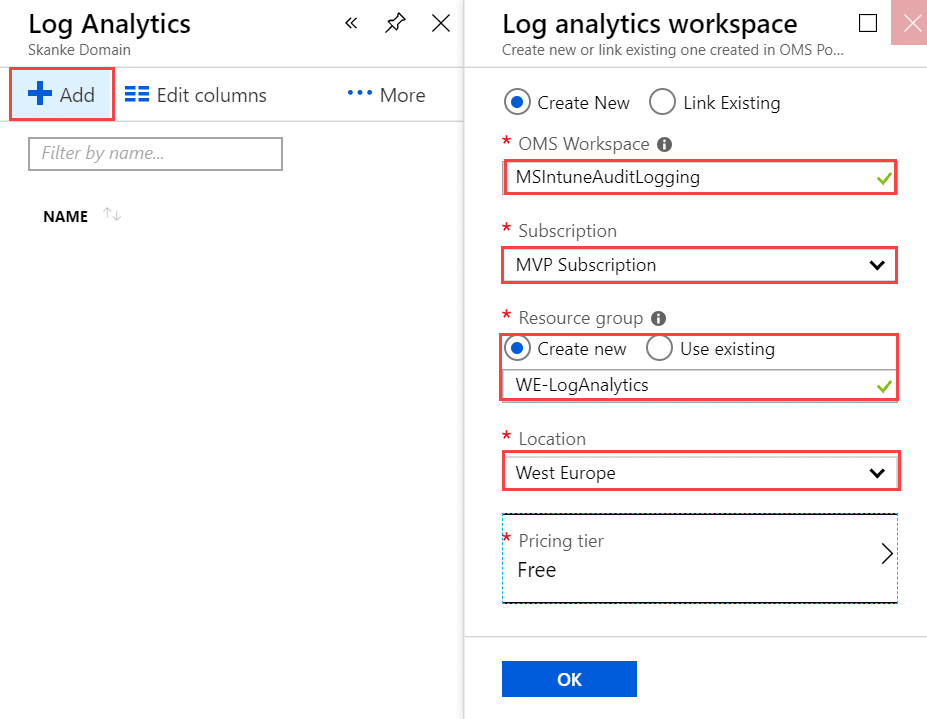
My Workspace is named MSInuneAuditLogging, select the correct Azure Subscription if you have more than one, create or reuse a Resource groups and select your location. The pricing tier is based on what you have available on your tenant/subscription only. Be aware that Free tier only have 7 days of data retention.
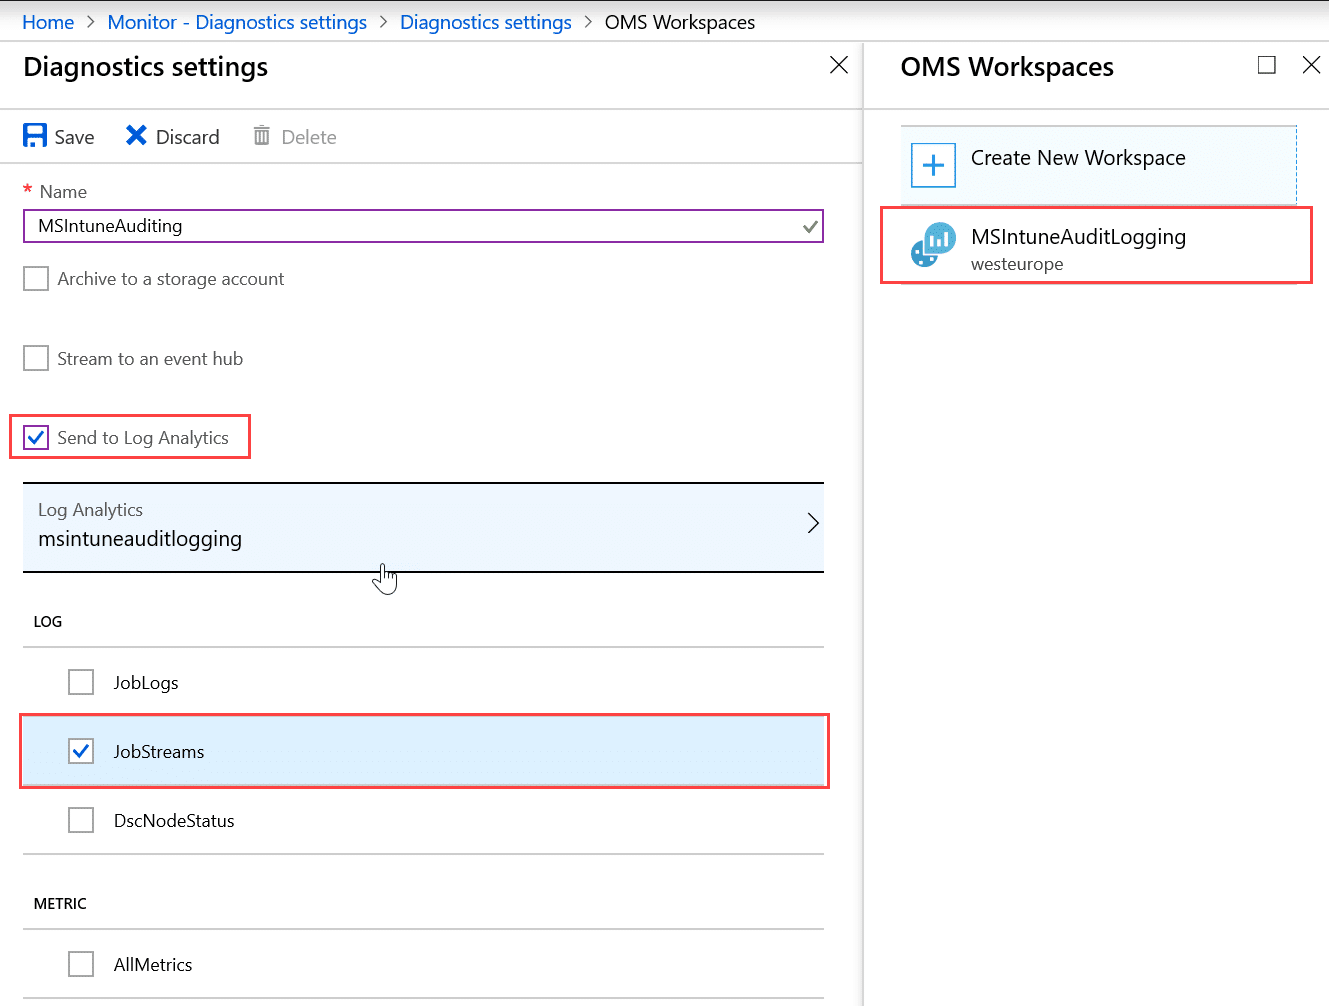
Now we need to enable diagnostics on our Automation account so that outputs from the runbook is sent to the workspace we created. Open Azure Monitor and go to Diagnostics Settings:
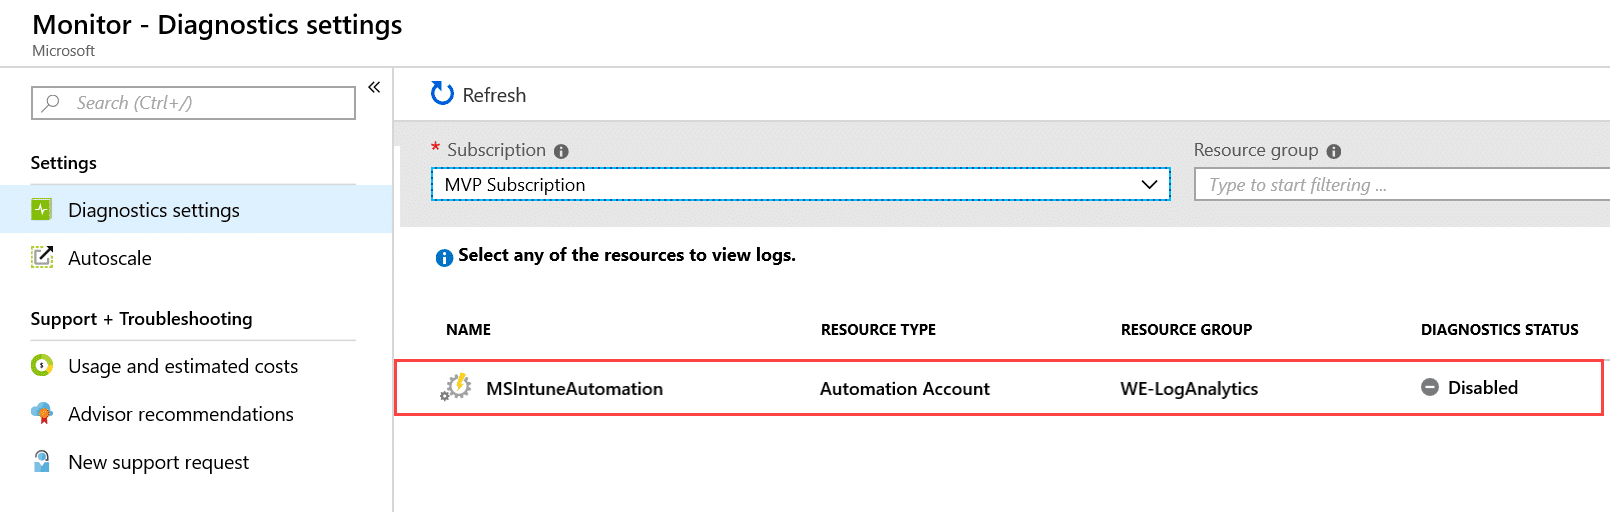
Open the MSIntuneAutomation Resource and Turn on diagnostics and configure the diagnostic settings to log JobStreams from the Automation account.
Now if we go back we should see that Diagnostics are enabled on the resource.

4. Create the Runbook script
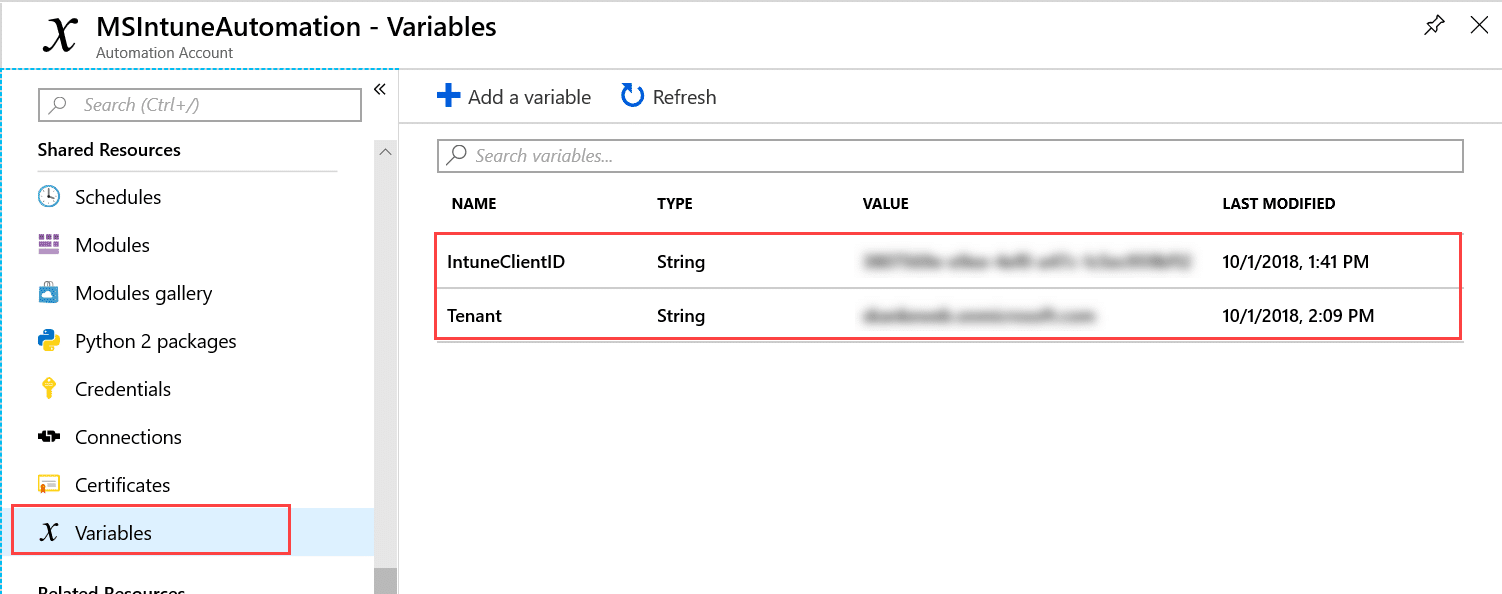
Now it is time to go back into our Automation Account and create the runbook that does the necessary work. We have already created the Automation Account and added credentials by following the post from Nickolaj. So lets move into the necessary configuration for our setup. We will start by adding some variables. If you are reusing my script you would need to use the same name on the variables as I have done. We need 2 variables, “IntuneClientID” and “Tenant” where the ClientID referes to the AppID of the app we created in step 1.
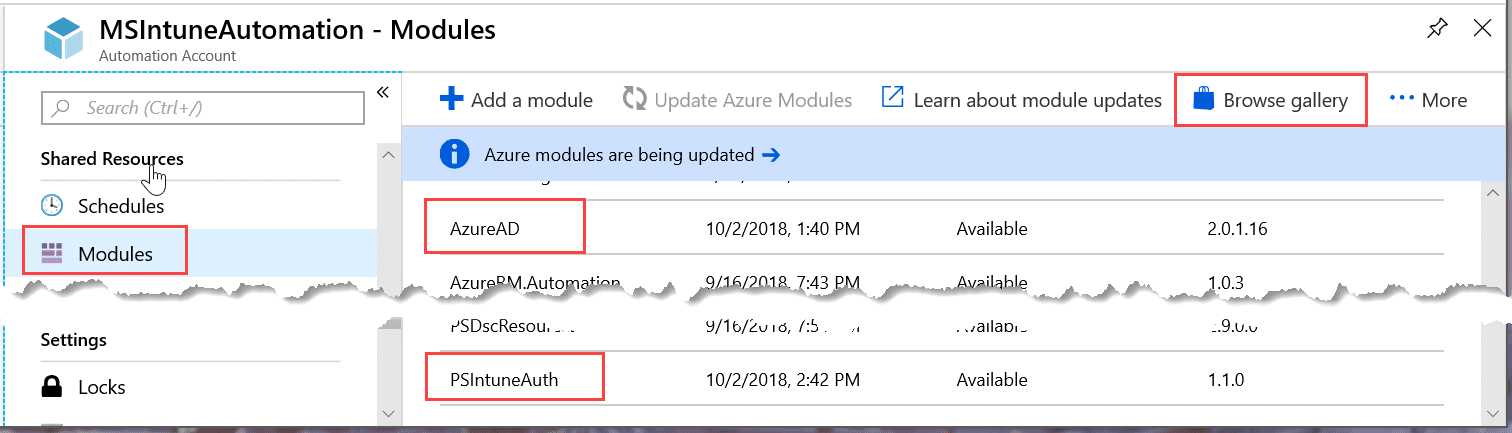
Also let us just verify that we have all the needed powershell modules available for the script, we need AzureAD and PSIntuneAuth Modules. If you don’t have them you can click on Browse gallery and search for them.
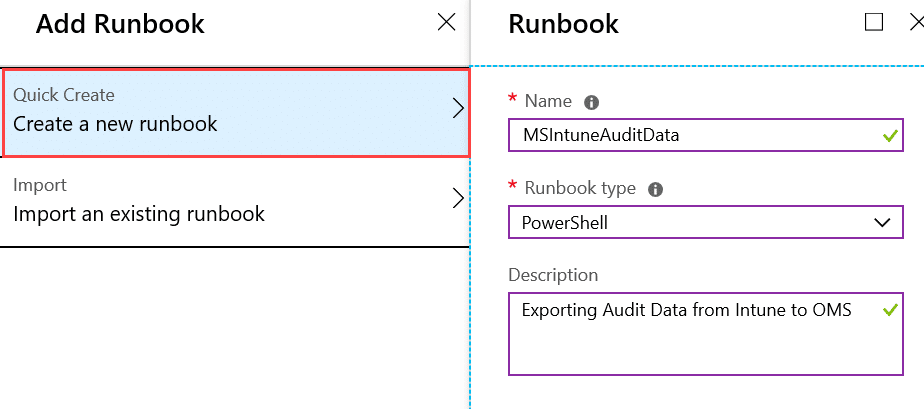
Now we can add the actual runbook
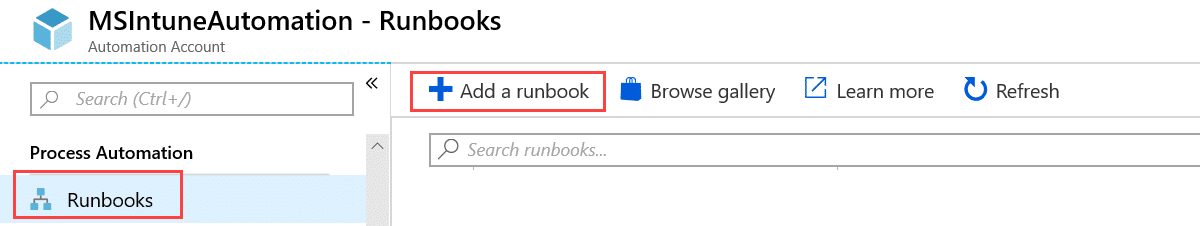
Give it a name, choose powershell as Runbook type and give it a description:
This will bring us straight into the Edit Powershell Runbook view where we can paste in our script. Also we can verify that we have our assets available.
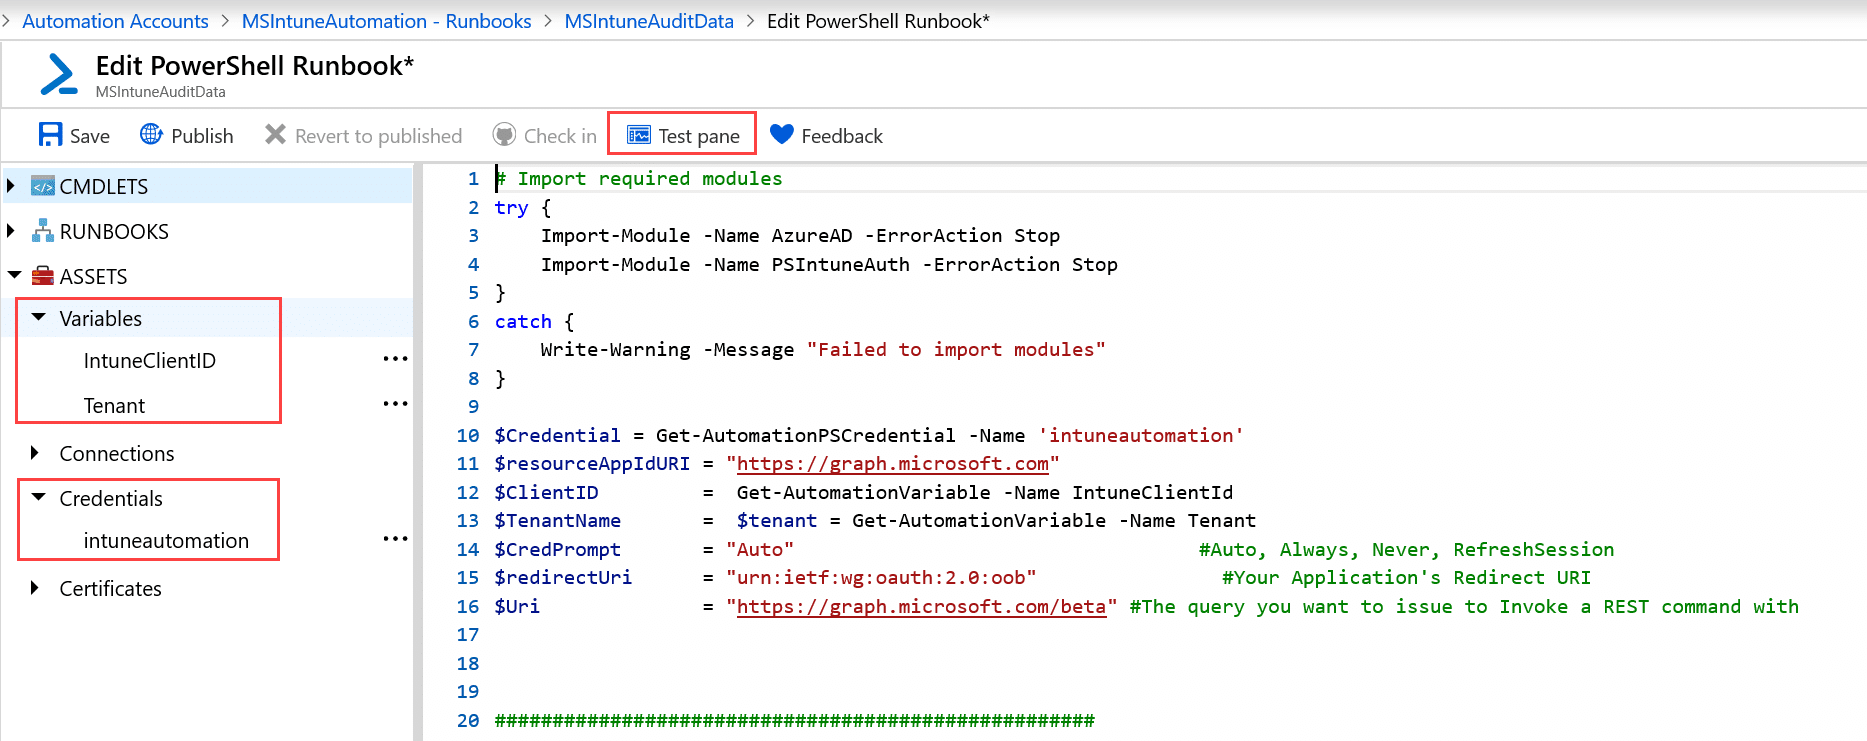
After we have pasted our script, click on Save and then we can go to the Test Pane and verify that our script is working as expected by clicking Start. The script I have used is available on Github
# This Runbook script requires use of Automation Credentials
# Import required modules
try {
    Import-Module -Name AzureAD -ErrorAction Stop
    Import-Module -Name PSIntuneAuth -ErrorAction Stop
}
catch {
    Write-Warning -Message "Failed to import modules"
}

$Credential = Get-AutomationPSCredential -Name 'intuneautomation'
$resourceAppIdURI = "https://graph.microsoft.com"
$ClientID         =  Get-AutomationVariable -Name IntuneClientId
$TenantName       =  $tenant = Get-AutomationVariable -Name Tenant
$CredPrompt       = "Auto"                                   #Auto, Always, Never, RefreshSession
$redirectUri      = "urn:ietf:wg:oauth:2.0:oob"                #Your Application's Redirect URI
$Uri              = "https://graph.microsoft.com/beta" #The query you want to issue to Invoke a REST command with


####################################################

Function Get-AuditCategories(){

<#
.SYNOPSIS
This function is used to get all audit categories from the Graph API REST interface
.DESCRIPTION
The function connects to the Graph API Interface and gets all audit categories
.EXAMPLE
Get-AuditCategories
Returns all audit categories configured in Intune
.NOTES
NAME: Get-AuditCategories
#>

[cmdletbinding()]

param
(
    $Name
)

$graphApiVersion = "Beta"
$Resource = "deviceManagement/auditEvents/getAuditCategories"

    try {

    $uri = "https://graph.microsoft.com/$graphApiVersion/$($Resource)"
    (Invoke-RestMethod -Uri $uri -Headers $AccessToken -Method Get).Value

    }

    catch {

    $ex = $_.Exception
    $errorResponse = $ex.Response.GetResponseStream()
    $reader = New-Object System.IO.StreamReader($errorResponse)
    $reader.BaseStream.Position = 0
    $reader.DiscardBufferedData()
    $responseBody = $reader.ReadToEnd();
    Write-Host "Response content:`n$responseBody" -f Red
    Write-Error "Request to $Uri failed with HTTP Status $($ex.Response.StatusCode) $($ex.Response.StatusDescription)"
    write-host
    break

    }

}

####################################################

Function Get-AuditEvents(){

<#
.SYNOPSIS
This function is used to get all audit events from a specific category using the Graph API REST interface
.DESCRIPTION
The function connects to the Graph API Interface and gets audit events from a specific audit category
.EXAMPLE
Get-AuditEvents -category "Application"
Returns audit events from the category "Application" configured in Intune
Get-AuditEvents -category "Application" -days 7
Returns audit events from the category "Application" in the past 7 days configured in Intune
.NOTES
NAME: Get-AuditEvents
#>

[cmdletbinding()]

param
(
    [Parameter(Mandatory=$true)]
    $Category,
    [Parameter(Mandatory=$false)]
    [ValidateRange(1,30)]
    [Int]$days
)

$graphApiVersion = "Beta"
$Resource = "deviceManagement/auditEvents"

if($days){ $days }
else { $days = 1 }

$daysago = "{0:s}" -f (get-date).AddDays(-$days) + "Z"

    try {

    $uri = "https://graph.microsoft.com/$graphApiVersion/$($Resource)?`$filter=category eq '$Category' and activityDateTime gt $daysago"
    Write-Verbose $uri
    (Invoke-RestMethod -Uri $uri -Headers $AccessToken -Method Get).Value

    }

    catch {

    $ex = $_.Exception
    $errorResponse = $ex.Response.GetResponseStream()
    $reader = New-Object System.IO.StreamReader($errorResponse)
    $reader.BaseStream.Position = 0
    $reader.DiscardBufferedData()
    $responseBody = $reader.ReadToEnd();
    Write-Host "Response content:`n$responseBody" -f Red
    Write-Error "Request to $Uri failed with HTTP Status $($ex.Response.StatusCode) $($ex.Response.StatusDescription)"
    write-host
    break

    }

}

####################################################

# Acquire authentication token
try {
    $AccessToken = Get-MSIntuneAuthToken -TenantName $TenantName -ClientID $ClientID -Credential $Credential
    if ($AccessToken -ne $null) {
    }
}
catch [System.Exception] {
    Write-Warning -Message "Failed to retrieve authentication token"
}


$AuditCategories = Get-AuditCategories

if($AuditCategories){

    foreach($Category in $AuditCategories){

     $Events = Get-AuditEvents -Category "$Category"

        if($Events){

                foreach($Event in ($Events | Sort-Object -Property activityDateTime)){

                    $DisplayName = $Event.displayname
                    $ComponentName = $Event.componentName
                    $ActivityType = $Event.activityType
                    $ActivityDateTime = $Event.activityDateTime
                    $Application = $Event.actor.applicationDisplayName
                    $ActivityResult = $Event.activityResult
                    $UPN = $Event.actor.userPrincipalName
                    $ResourceDN = $Event.resources.displayName
                    $ResourceType = $Event.resources.type
                    $ResourceId = $Event.resources.resourceId

                    Write-Output "Displayname: $DisplayName, Component Name: $ComponentName, ActivityType: $ActivityType, Activity Date Time: $ActivityDateTime, Application: $Application, Activity Result: $ActivityResult, UPN: $UPN, Resource Name: $ResourceDN, Resource Type: $ResourceType, Resource ID: $ResourceId"
               }
        }
    }
}
https://github.com/JankeSkanke/PublicScripts/blob/master/AuditAutomationRunbook.ps1
The stream will display output when the test completes:
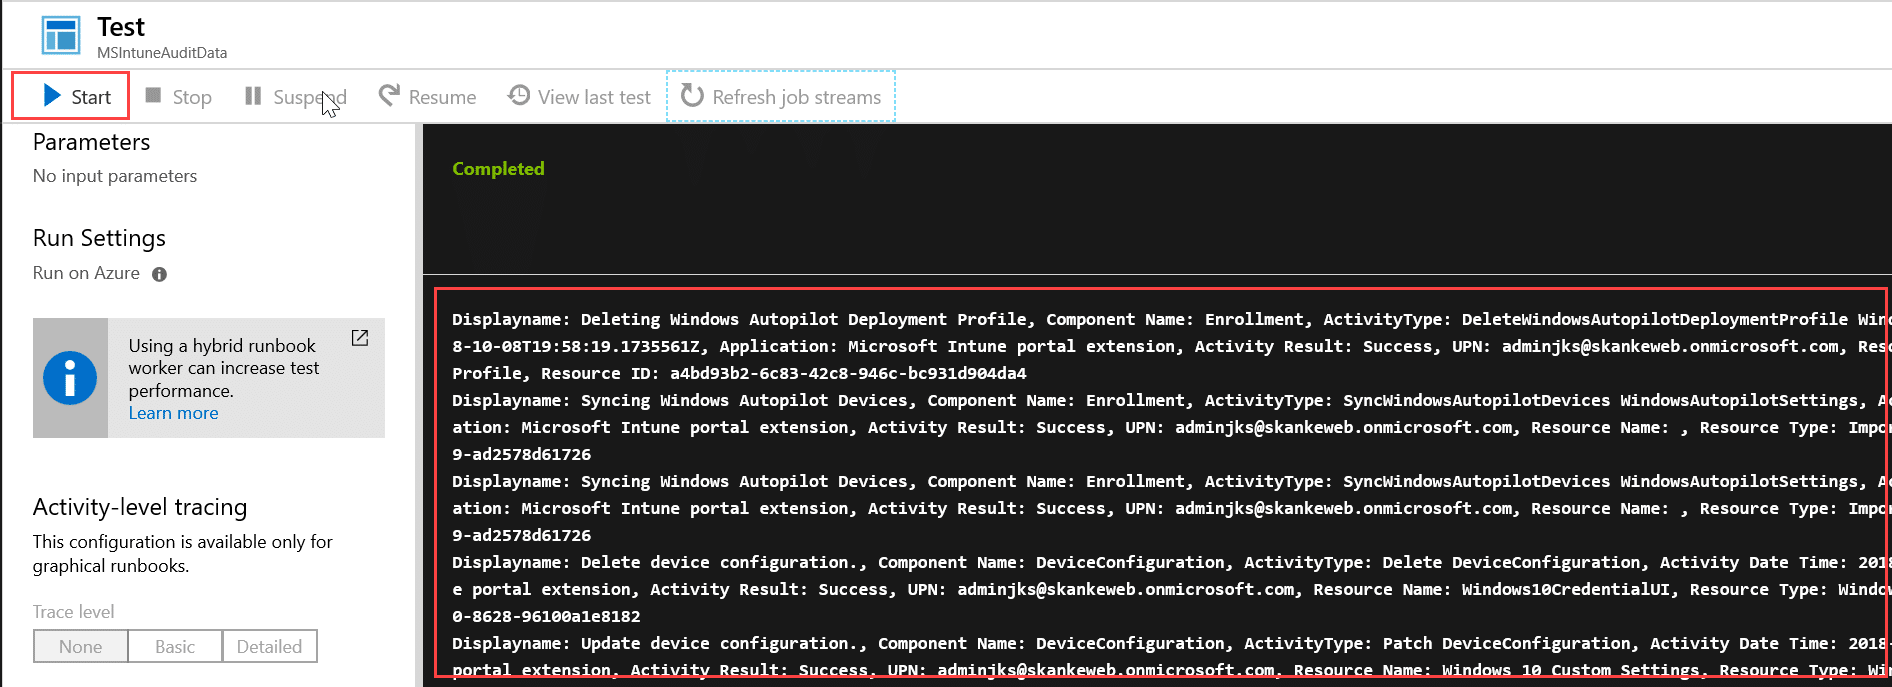
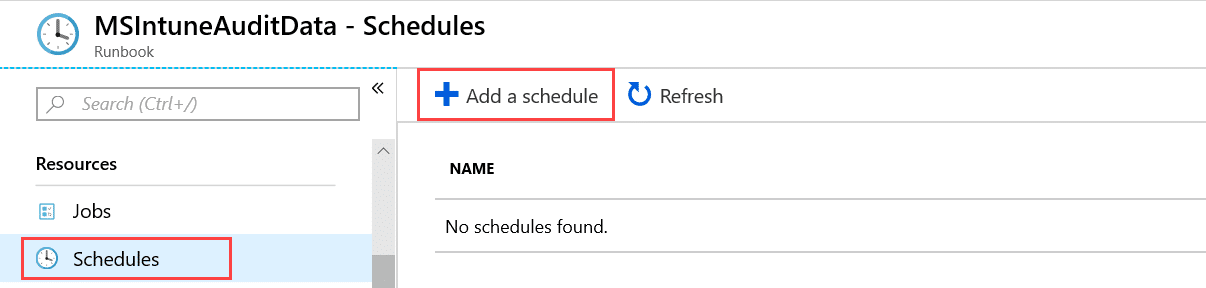
Now we see that the script is actually working and giving us the data we wanted. But right now, this doesn’t look that usefull does it? But let us go ahed and publish the runbook by closing the Test Pane and click on Publish. Now we are ready to set this up on a schedule. Be aware that if the script runs more than once pr day you will get duplicated data in Log Analytics as the script gathers all events from the last day every time it runs. Go to Schedules and “Add a schedule”
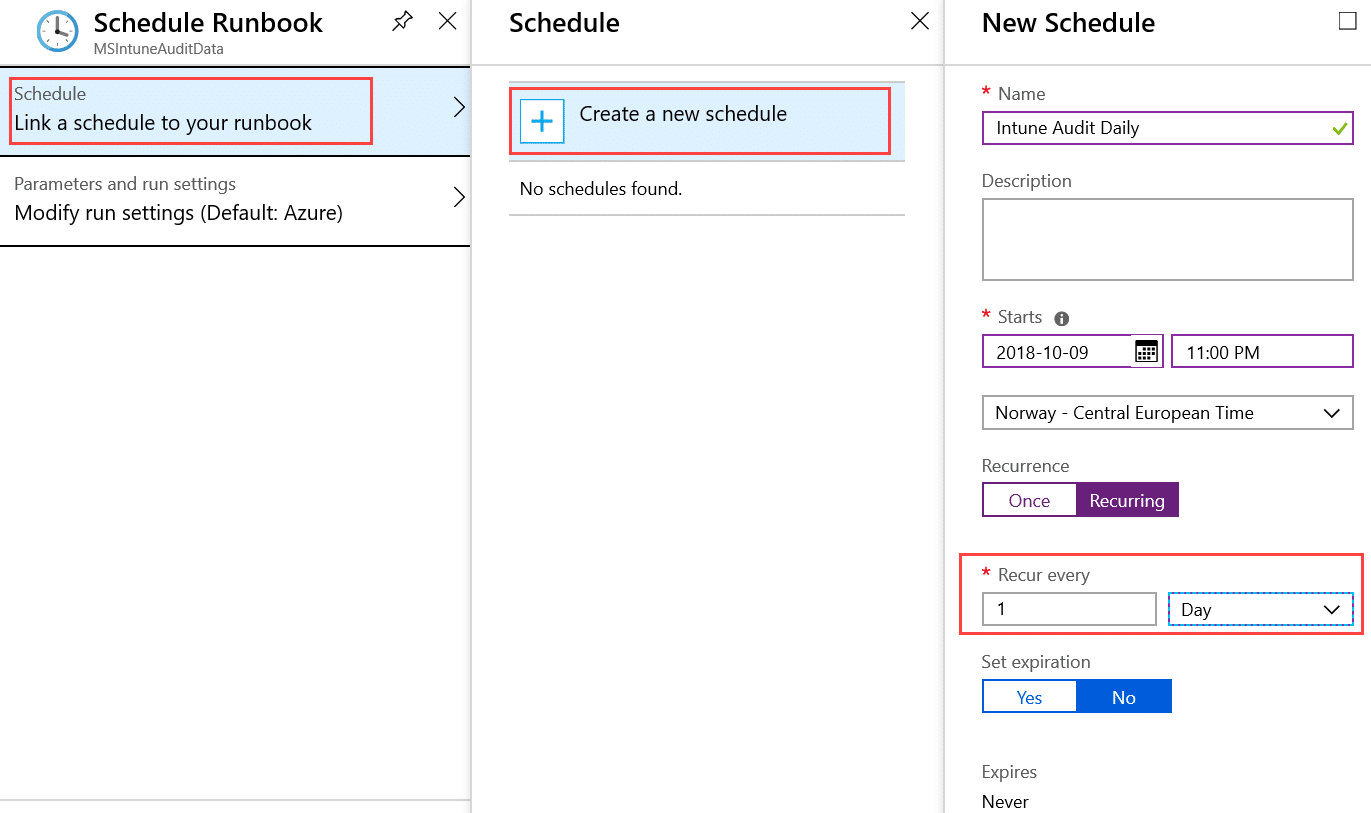
We create a new Schedule, give it a name, when to do the first run, which timezone to run in, recurrence every 1 day and never expire. (If you wanna have a test run today by manualy trigger the runbook, set first run 24 hours in the future)
So to test that I get data and to be able to verify I have my data in the correct place in OMS, I will start the runbook once manually. Go to the Overview tab of your runbook and click on Start. This will bring you into the job details of your running job where you can see outpout, logs, warnings and errors:
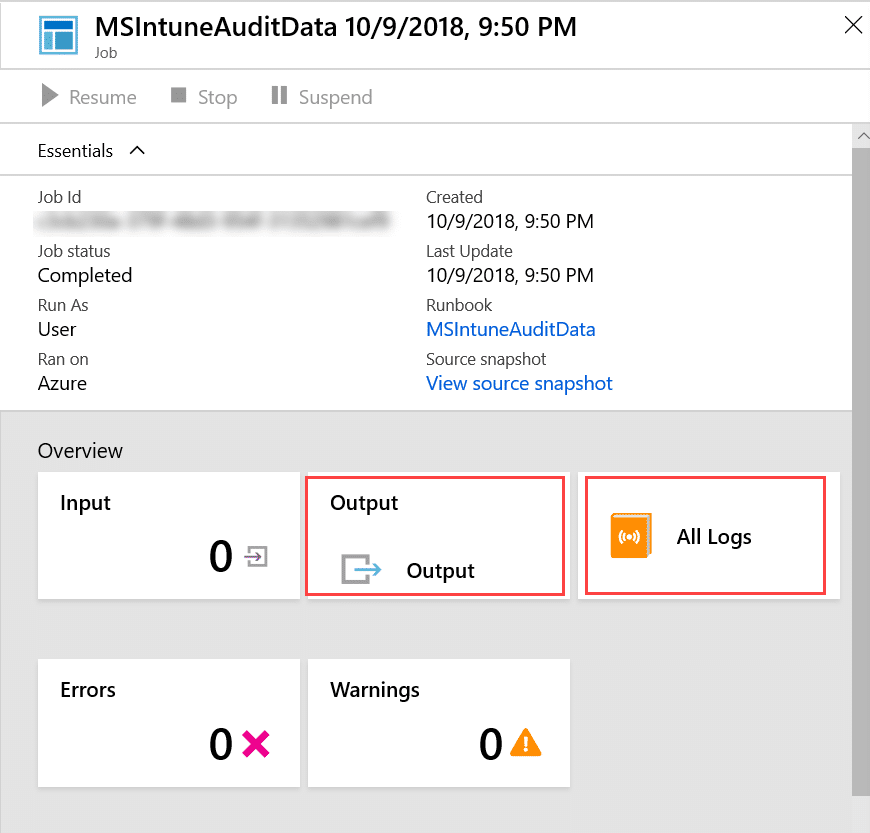
When the runbooks is done, if you have actual audit data from the last day, you can see your data in both Output and All Logs here. If you do not have any output, do a couple of changes inside intune (ex rename a policy) and run the job again.
5. Define my Log analytics Query
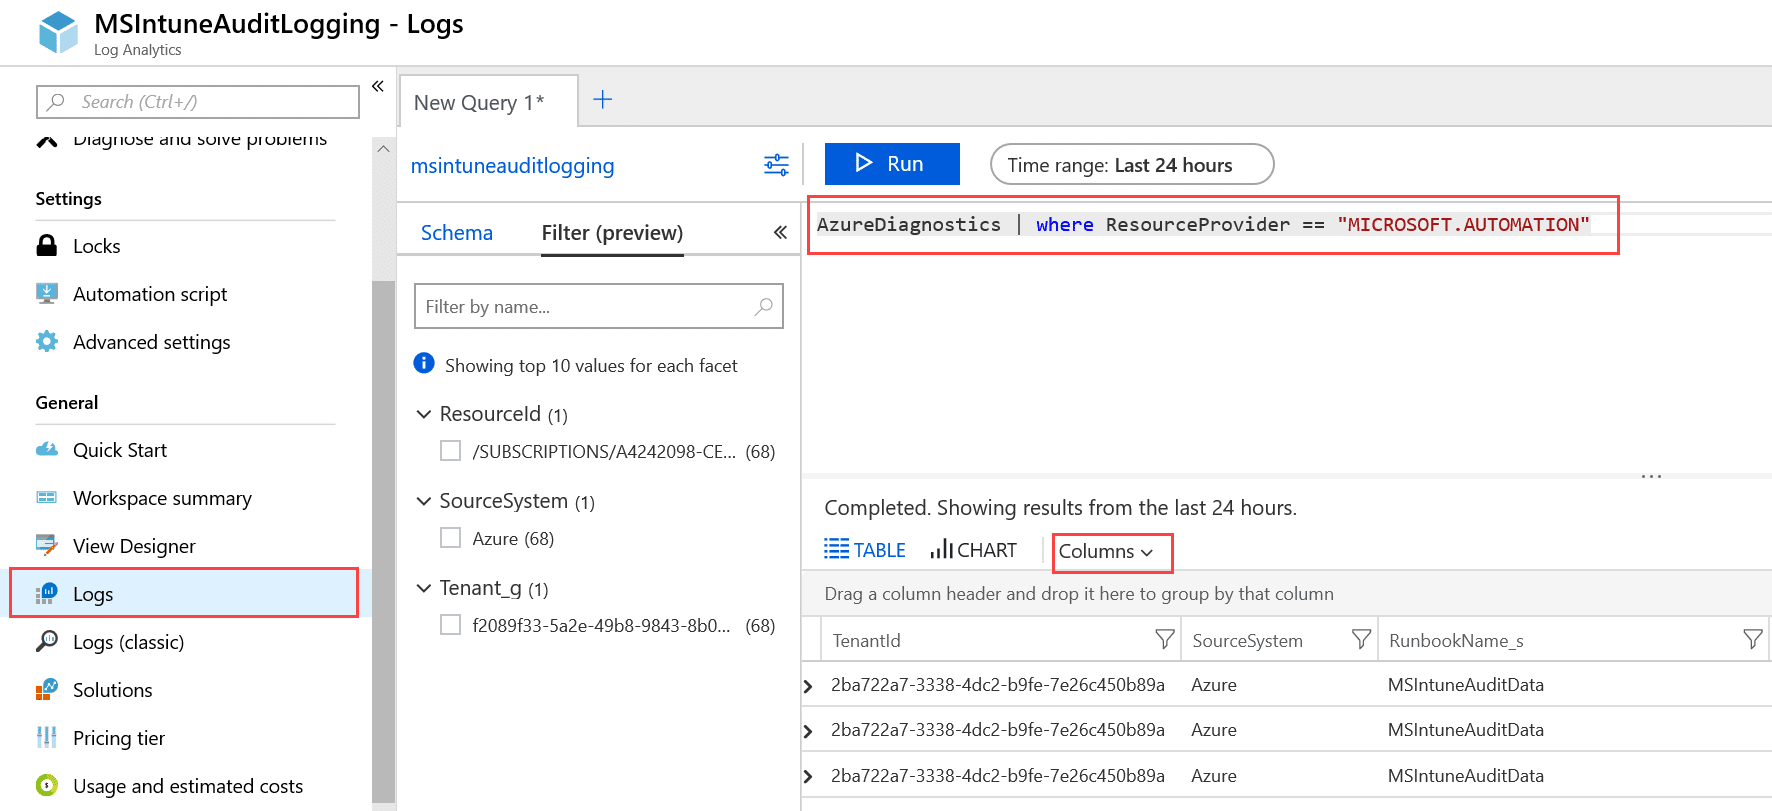
Now that the runbook is working and running on a schedule, we should move over to Log Analytics to verify we have the data. I did some basic Column filtering to show that we actually have data from our runbook present. The query I have runned in here for this test is
AzureDiagnostics | where ResourceProvider == "MICROSOFT.AUTOMATION"
So let us make this even more pretty by doing some more specific query and parse the result to our needs:
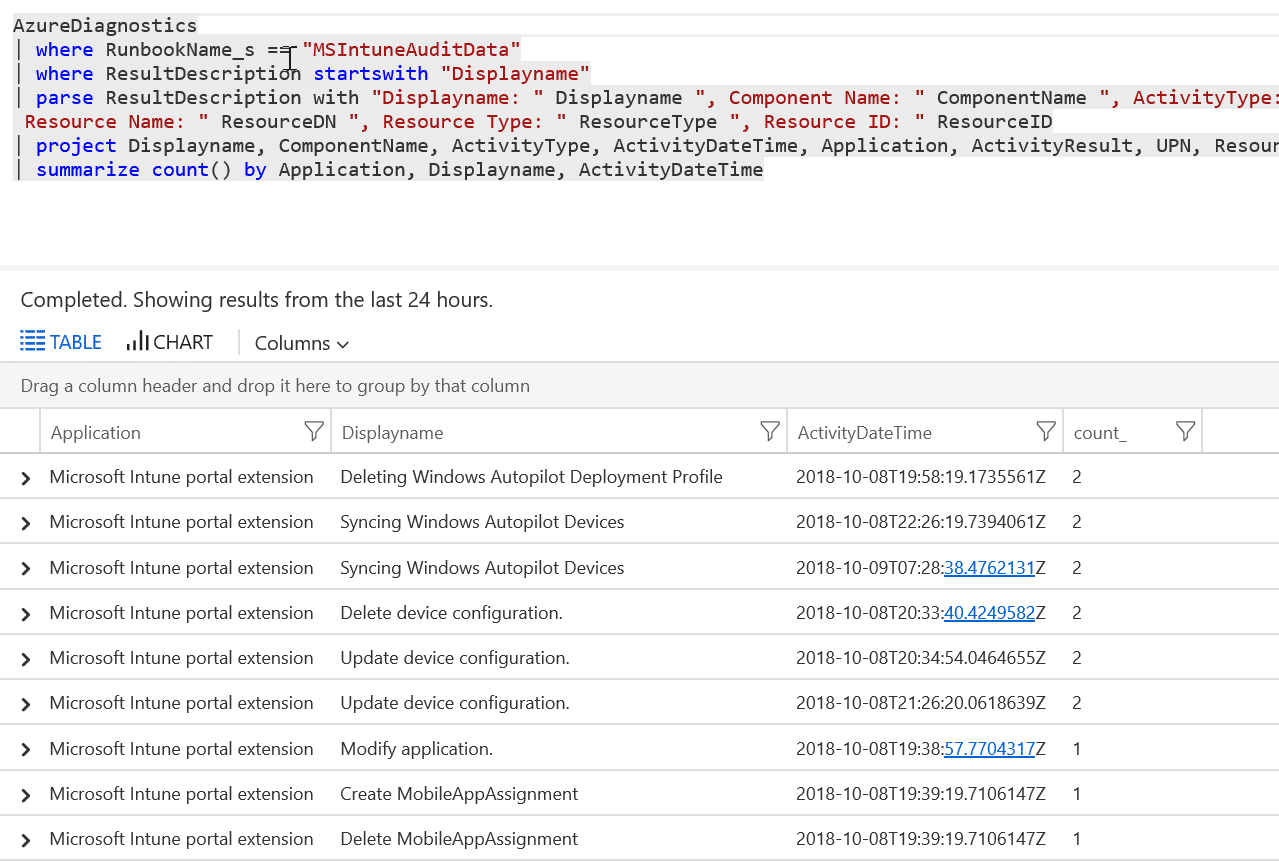
AzureDiagnostics
| where RunbookName_s == "MSIntuneAuditData"
| where ResultDescription startswith "Displayname"
| parse ResultDescription with "Displayname: " Displayname ", Component Name: " ComponentName ", ActivityType: " ActivityType ", Activity Date Time: " ActivityDateTime ", Application: " Application ", Activity Result: " ActivityResult ", UPN: " UPN ", Resource Name: " ResourceDN ", Resource Type: " ResourceType ", Resource ID: " ResourceID
| project Displayname, ComponentName, ActivityType, ActivityDateTime, Application, ActivityResult, UPN, ResourceDN, ResourceType, ResourceID
| summarize count() by Application, Displayname, ActivityDateTime
And if we click on Chart, and choose Pie and Displayname we can get a nice graphical presentation like this:

So now we have all our data represented the way we want, so let us create a Donut for our main Dashboard to finish this up
Add and pin the Cool Donut on my dashboard
Go back to the main view and choose View Designer. Here we simply click on Donut, Give it a name and switch the query with the query we used in the log search. On the last line we need to change the summarize to be by only ActivityType.
| summarize count() by ActivityType
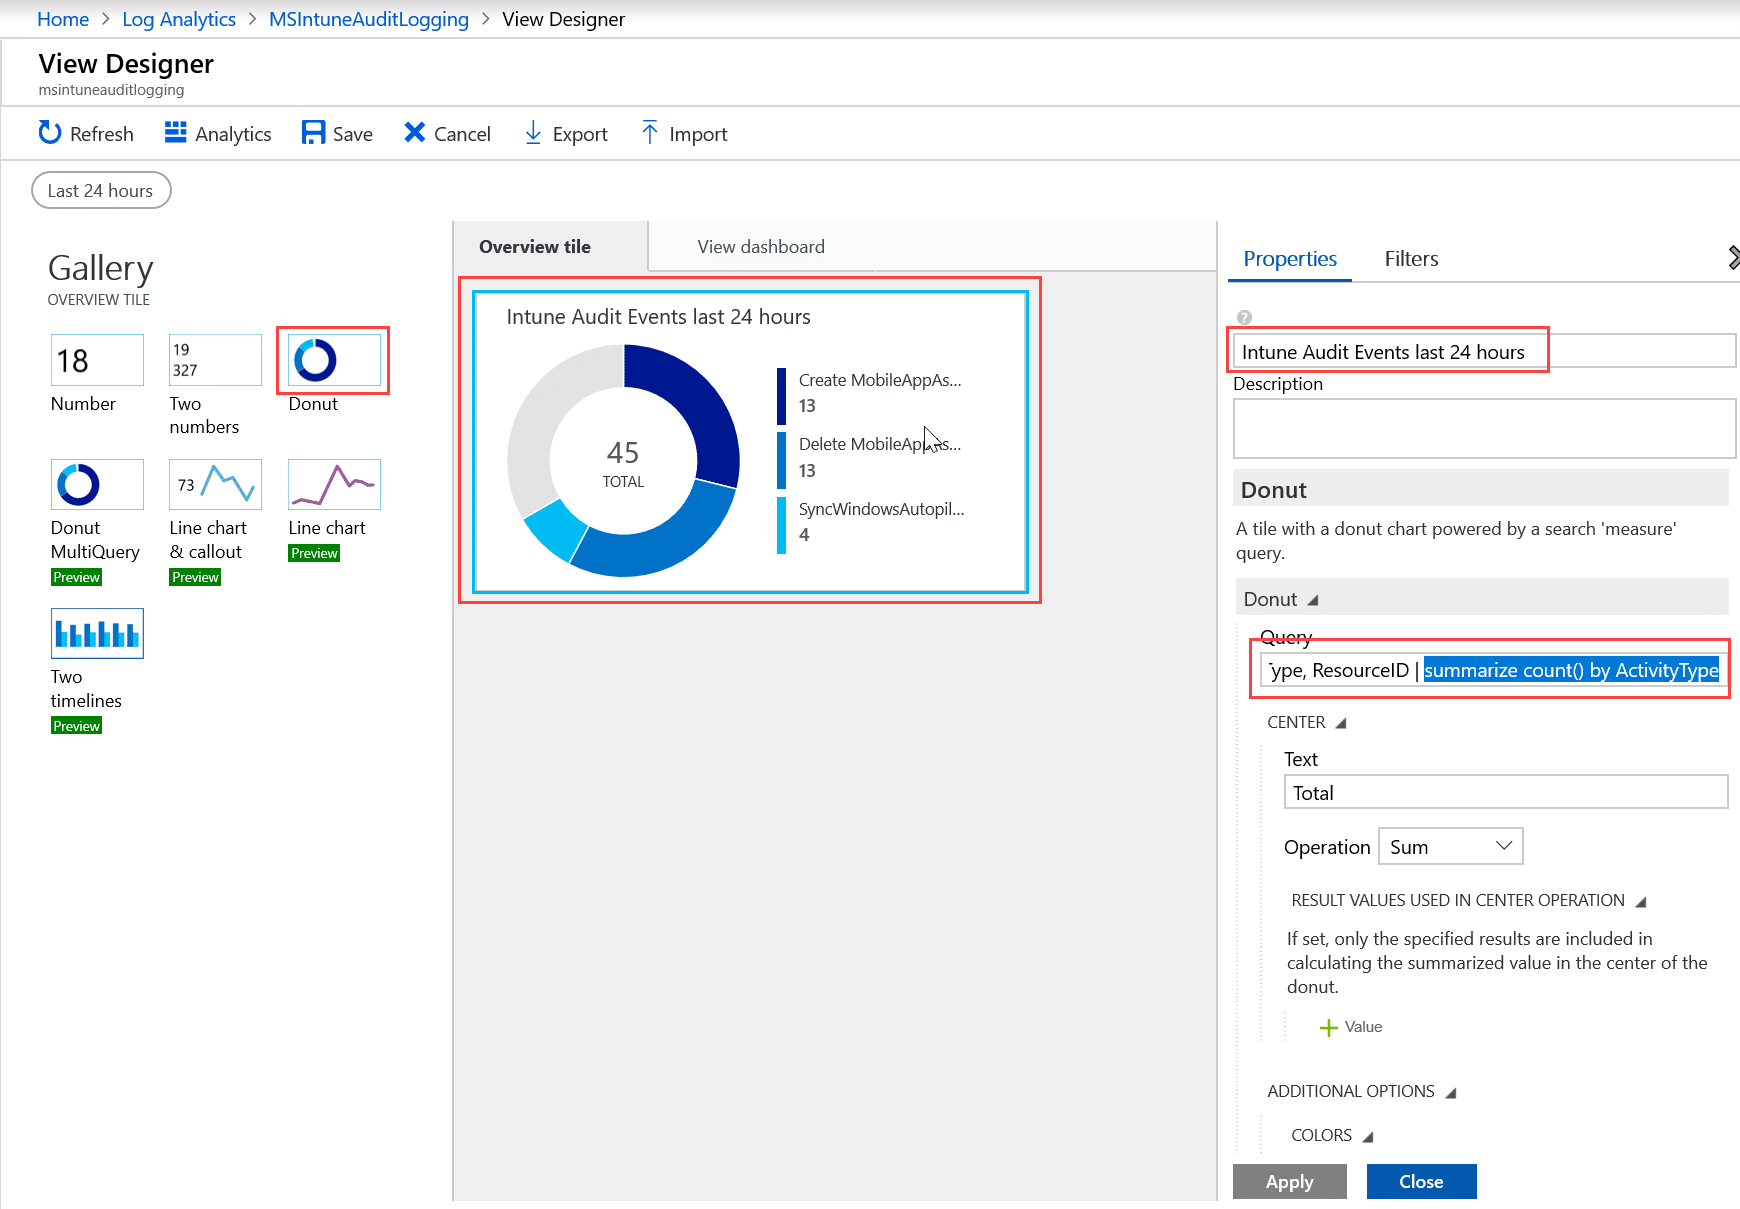
Now we do have the Donut and are ready to pin it to our dashboard. So click on Save. When you get to the next page, you have the option to Pin this to your main dashboard. So now if I take a look on my dashboard this is what I see:


Thank you for the perfectly written article. Within the script, you are using the credentials of the account “intuneautomation” (line 11).
I can’t find information about this account within the blog. But I assume the solution only works, if I have an account with Intune Administrator role asigned?
In this demo-setup I have used a Global Admin account. The best of course is to use a service account with the least amount of privilegdes needed.